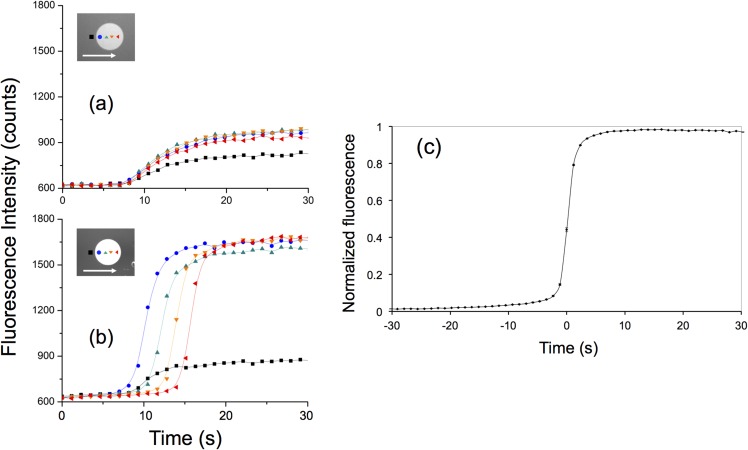
FIG. 3.
Fluorescence measurements from single CCD image pixels (size: 0.65 × 0.65 μm) when flowing (a) 1 μM ncDNA solution and (b) 1 μM cDNA solution. The location of the probed pixels along the functionalized sensing pattern and the direction of the fluid flow are shown in the insets. The black curve on each plot corresponds to the fluorescence background measured in the channel. (c) Averaged plot of 70 response curves obtained by measuring the fluorescence onto 0.42 μm2 pixels located within different sensing patterns from single nanoslit sensor chip. The average values were obtained after superimposing pixels with normalized fluorescence signal and shifted time origin. Measurements were carried out in a single experiment where 1 μM cDNA was injected in the nanoslit. The small standard errors illustrate the excellent reproducibility of the measurements.

