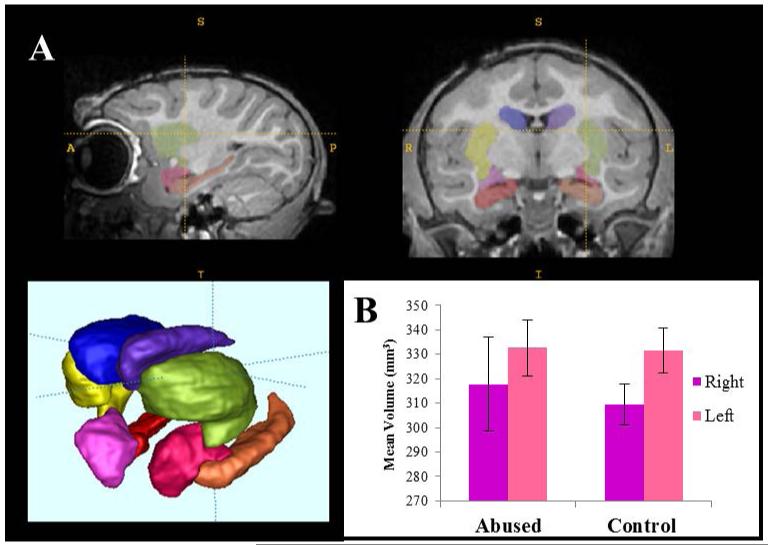
Figure 3. Amygdala volumes measured using structural MRI.
(A) Example of automatic segmentation of subcortical structures, including the right (purple) and left (pink) amygdala. (B) No significant differences in amygdala volumes (right, left or right/left ratio) were detected between abused and control animals (uncorrected for brain volume, but similar results detected after correction).

