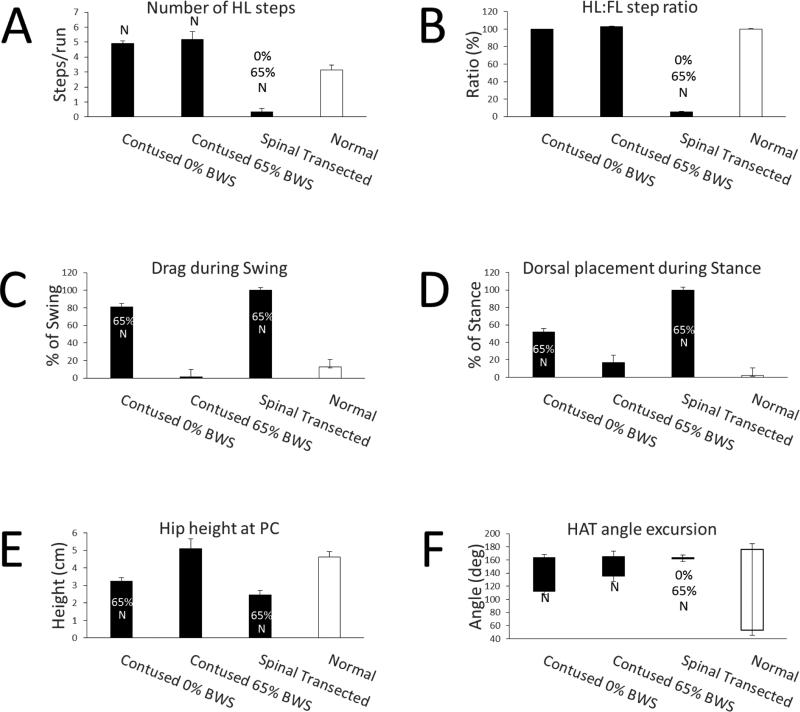
Fig. 2.
The number of hindlimb steps per run (A), ratio of hindlimb to forelimb steps (B), drag during swing (C), dorsal paw placement during stance (D), hip height at paw contact (E) and the hip-ankle-toe (HAT) angle excursion (F). The black bars are data from six spinally contused rats stepping at 0% and 65% body weight support and from the same rats 3 weeks after a spinal cord transection. The white bars are data from normal rats. Average ± SE are shown. 0%, 65% and N denote statistically different than 0% BWS, 65% BWS and normal respectively (p<0.05). BWS, body weight support.

