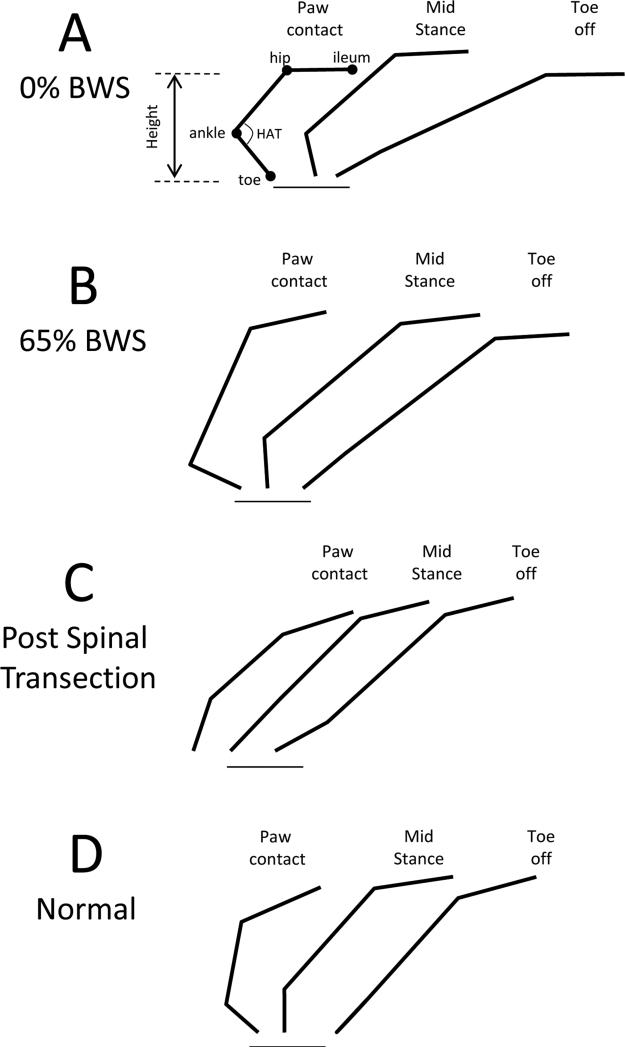
Fig. 3.
Stick figure representations of the hindlimbs during the stance phase of stepping in a spinally contused rat at 0% BWS (A), a spinally contused rat at 65% BWS (B), a spinal cord transected rat (C) and a normal rat (D). In (A), the ileum, hip, ankle and toe joints are illustrated in with black circles, the hip-ankle-toe (HAT) angle is shown with a semicircle and the hip height (hip-toe) is shown with the arrow. The horizontal line below the stick figures shows the approximate location of the floor.

