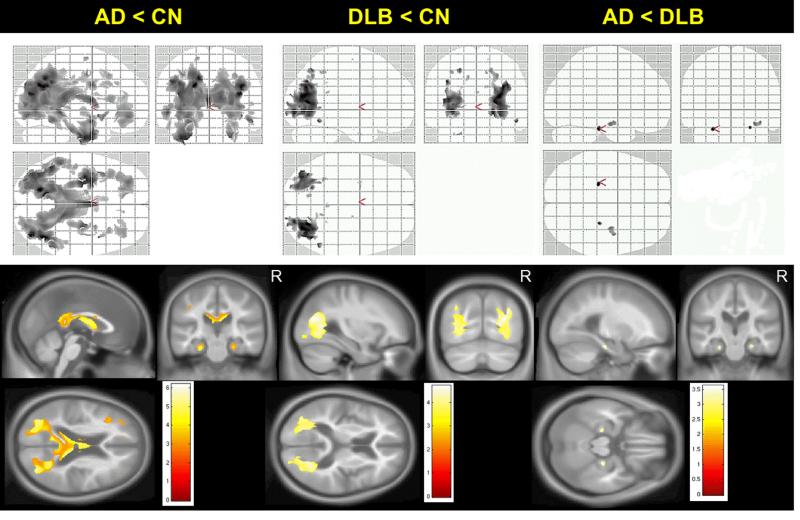
Figure 1. Patterns of differences in FA between clinical groups on voxel-based analysis.
Voxel-level maps show topographic pattern of between-group differences in FA. FA maps overlaid on glass brain from SPM (top row) or anatomical sections (bottom row) show magnitude of the differences in FA using side T-statistic bars, p<0.001(uncorrected). AD patients have wide-spread FA decreases in temporo-parietal, occipital and frontal white matter compared to CN (left column). DLB patients have reduced FA confined to parieto-occipital white matter compared to CN (middle column). In AD, reduced FA in parahippocampal white matter is observed compared to DLB patients (right column).

