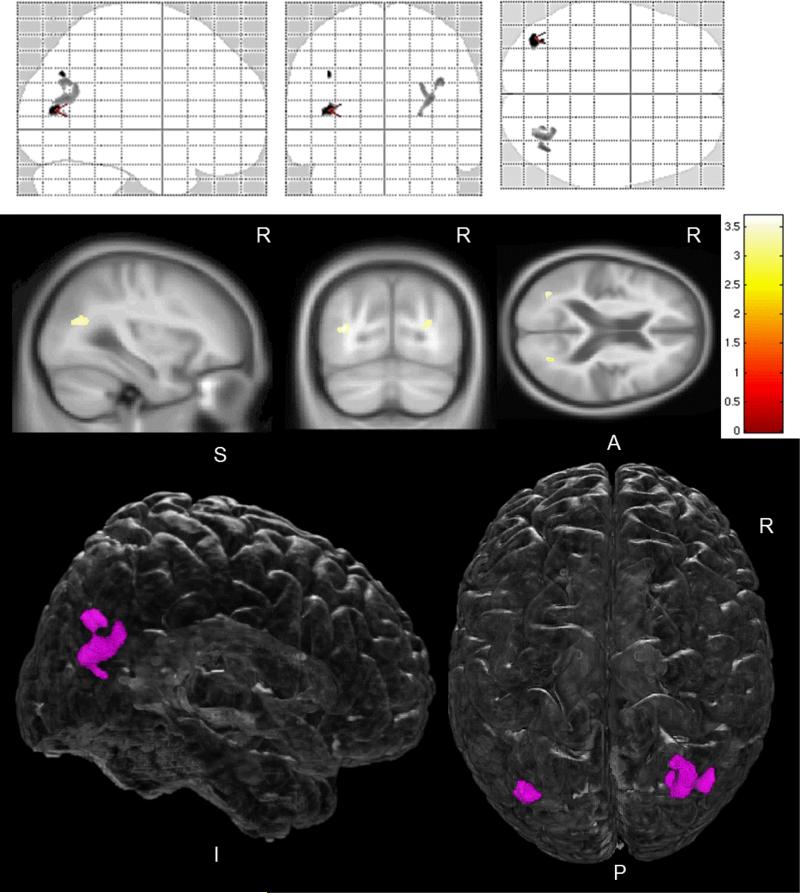
Figure 3. Pattern of reduced FA in DLB patients compared to CN, adjusted for Aβ load.
Voxel-level maps show pattern of reduced FA in DLB patients compared to CN. FA maps overlaid on glass brain from SPM (top row) or anatomical sections (middle row) show magnitude of the FA differences between these two groups using side T-bars, p<0.001(uncorrected) on voxel-based analysis. Bottom row shows FA differences overlaid on a 3D glass-brain render from MRIcroGL (http://www.mccauslandcenter.sc.edu/mricrogl/), with FA decreases confined to a well circumscribed region in parieto-occipital white matter.

