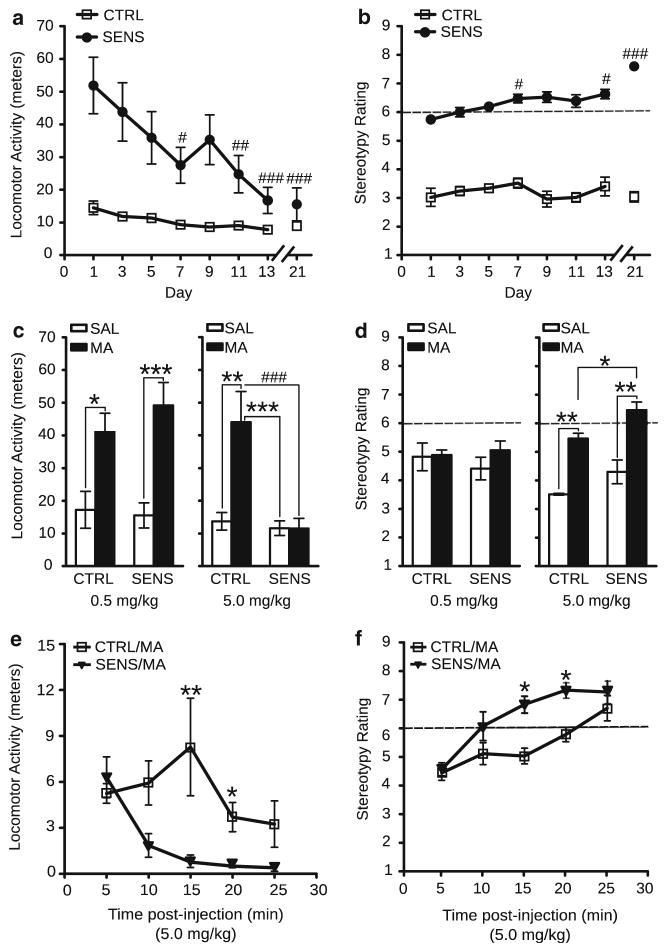
Fig. 1.
Locomotor activity and stereotypy during the induction phase and MA challenge. (a) Mean locomotor activity immediately following injections for each day of the induction phase (SENS, n=20; CTRL, n=17). (Bonferroni correction, #p<0.05; ##p<0.005; ###p<0.0005—significantly lower within-group locomotor activity compared with day 1 in SENS animals). (b) Mean stereotypy during the induction phase (SENS, n=9; CTRL, n=8). (Dunn’s, #p<0.05; ###p<0.0005—significantly greater within-group stereotypy compared with day 1 in SENS animals). (c) Locomotor activity on days 54 and 55 following the 0.5 mg/kg MA dose (left; SENS, n=12; CTRL, n=9) and 5.0 mg/kg dose (right; SENS, n=8; CTRL, n=9). (Bonferroni correction: *p<0.05; **p<0.005; ***p<0.0005—significantly different than rats that received a SAL injection). (Bonferroni correction: ###p<0.0005—significantly different than rats that received a MA injection). (d) Stereotypy on days 54 and 55 following treatment with 0.5 mg/kg MA (left; SENS, n=12; CTRL, n=9) and 5.0 mg/kg dose (right; SENS, n=8; CTRL, n=6); (Mann–Whitney, *p<0.05—significantly different than CTRL rats that received a MA injection); (Mann–Whitney, *p<0.005—significantly different than rats that received a SAL injection). (e) Locomotor activity post-injection on the 5.0 mg/kg challenge day (SENS, n=8; CTRL, n=6). (Bonferroni correction, *p<0.01; **p<0.001—significantly different than SENS animals that received a MA injection). (f) Stereotypy post-injection on the 5.0 mg/kg challenge day (SENS, n=8; CTRL, n=6). (Mann–Whitney, *p<0.01). All data are depicted as mean±SEM

