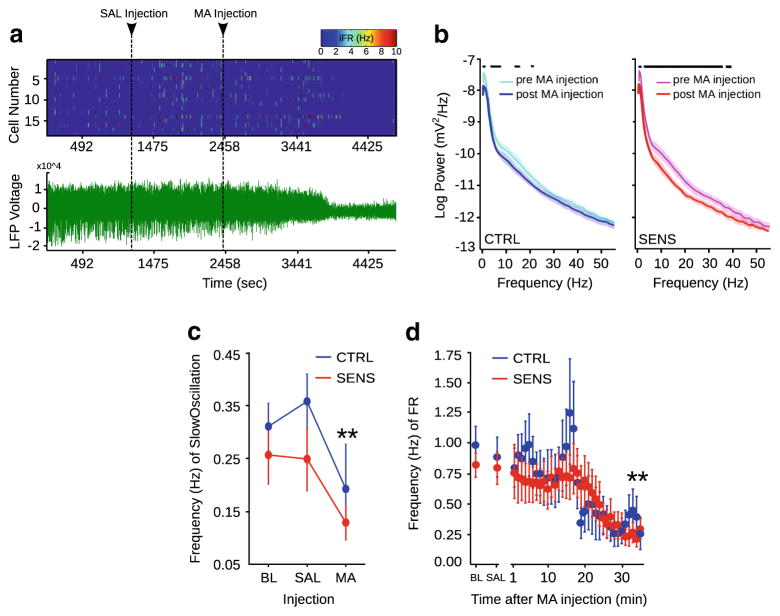
Fig. 3.
(a) Representative spike trains (top) and an LFP trace (bottom) from a single animal throughout an experiment. (b) The mean (solid line)±SEM (shaded portion) of log spectral power of LFPs recorded from CTRL (left) versus SENS (right) animals pre-and post-injection. (c) Frequency of SO (d) and frequency of FR during the entire recording session; (Tukey’s post-hoc, **p<0.005—significantly different than both groups during baseline)

