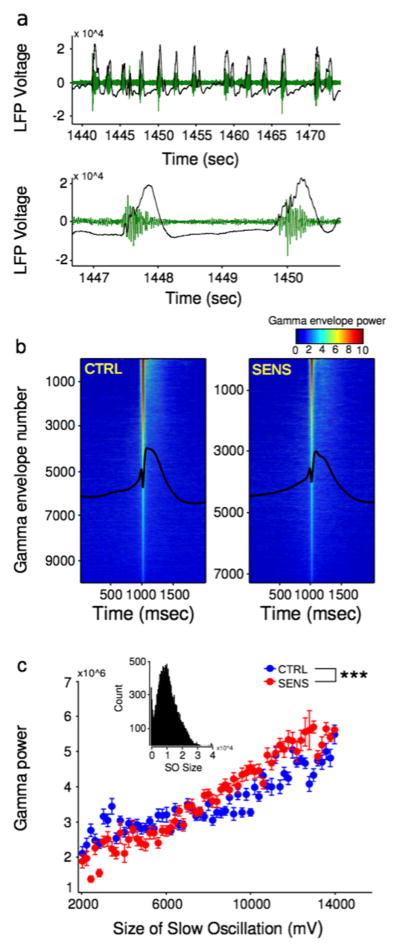
Fig. 4.
(a) SO and gamma oscillation coupling during baseline. Representative SOs and gamma oscillations in a single animal, with a zoomed in representation from 1446 to 1451 s below. (b) Color: gamma envelope power for all SOs present in the dataset from all animals sorted via most gamma power (top) to least (bottom). Black: the overall mean from all SOs. (c) The relationship between the size of the SO and gamma power. The inset shows the distribution of sizes of SO collapsed on treatment. (Mixed design factorial ANOVA, treatment×size of SO interaction, ***p<0.0001)

