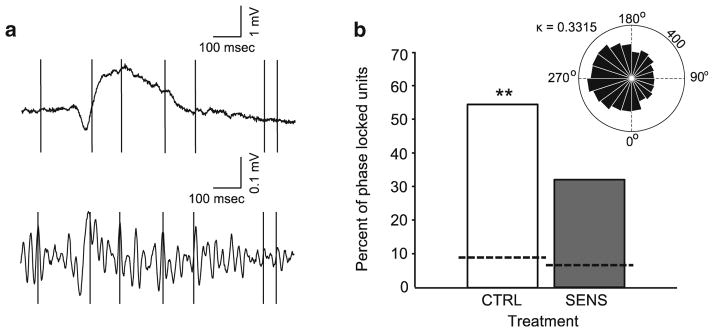
Fig. 5.

(a) A representative example of a SO (top) and the same example bandpass filtered in the gamma band (bottom) during baseline from a single animal. The vertical black lines represent spiking activity of a single cell, notice they align with the peaks of the gamma oscillation. (b) Percentage of gamma phase-locked cells in the CTRL (white bar) and SENS (gray bar) groups with dashed lines reflecting chance levels of phase locking from surrogate data. (Fisher’s exact test, **p<0.001—significantly different than SENS group). The inset shows a rose plot of a gamma phase-locked cell from a single animal during baseline recording
