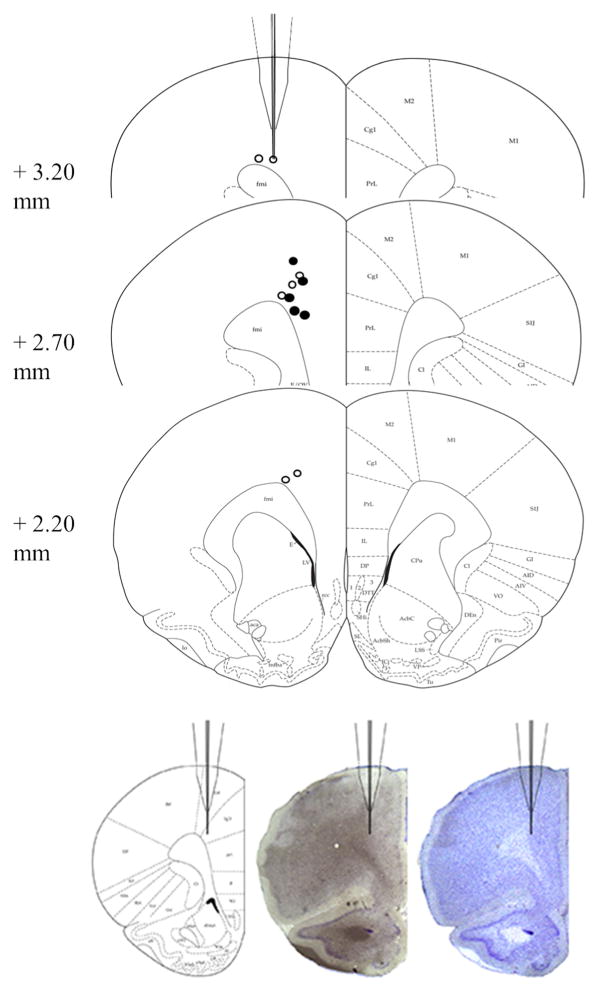
Fig. 6.
Three coronal sections (Paxinos and Watson 1997) from +3.20 to +2.20 mm depict the unilateral placement of probes (AP, +2.70; ML, + 0.50; DV, −1.5) relative to bregma, with photomicrographs of a successful placement from one animal shown directly below. Open circles represent placements for CTRL animals (n=7), and closed circles represent placements for SENS animals (n=6)

