Figure 3.
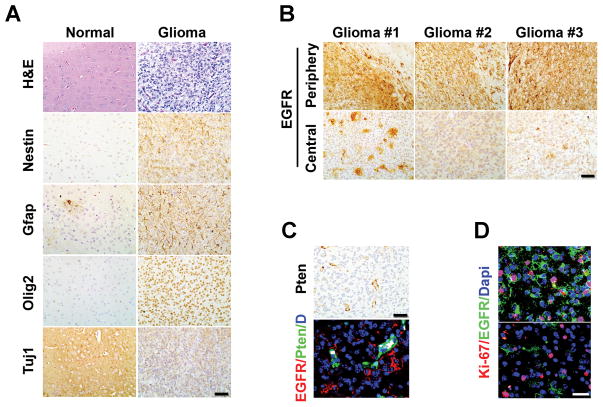
The iEIP malignant gliomas are heterogeneous. A, iEIP glioma cells display multi-lineage differentiation. Normal mouse brain and iEIP glioma sections were stained with H&E or antibodies against indicated lineage markers. B, IHC staining against EGFR was performed on sections from different regions of three independent iEIP gliomas. Stronger EGFR expression was found at invasive edges of tumor periphery compared to relatively solid tumor centers. Scale bars represent 50 μm. C, shown are representative IF images of iEIP gliomas with interspersed EGFR-high and -low tumor cells. Tumor cells were distinguished by their negative Pten expression compared to embedded Pten-positive normal cells (green). D, co-staining of EGFR and Ki67 antibodies revealed that EGFR-high and EGFR-low tumor cells both retained proliferation capacity. Scale bars represent 100 μm.

