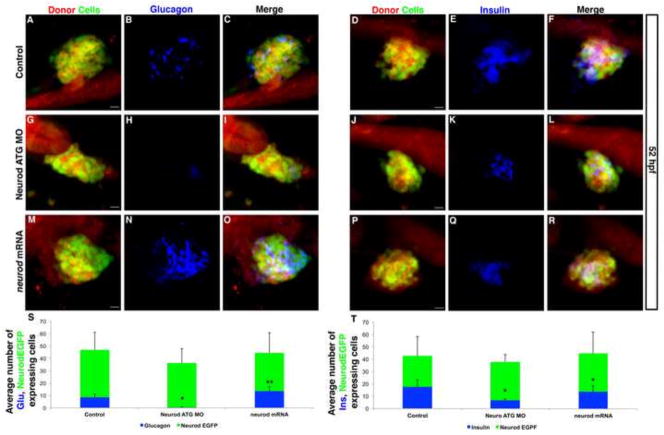
Fig. 5. Increased Neurod levels promote alpha cell differentiation; beta cells are less sensitive than alpha cells to Neurod knockdown.
(A–R) Confocal images (merged z-stacks) of representative 52 hpf chimeric specimens in which the entire endoderm is derived from control (A–F), Neurod morphant (G–L) or neurod mRNA injected (M–R) donor cell transplants. Embryos are immunolabeled for EGFP (green; A, D, G, J, M, P) for glucagon (blue; B, H, N) and for insulin (blue; E, K, Q). EGFP and Rhodamine Dextran (red) labels donor-derived cells (A, D, G, J, M, P). Merged images with all three colors are also shown (C, F, I, L, O, R). (S) Mean (± s.d.) average number of cells expressing glucagon and EGFP-expressing endocrine cells, from a minimum of 4 chimeric embryos per group. *, P<0.002, **, P<0.01; t-test, two-tailed distribution. (T) Mean (± s.d.) average number of cells expressing insulin and EGFP-expressing endocrine cells, from a minimum of 5 chimeric embryos per group. *, P<0.004; t-test, two-tailed distribution. Scale bar = 10 μm.

