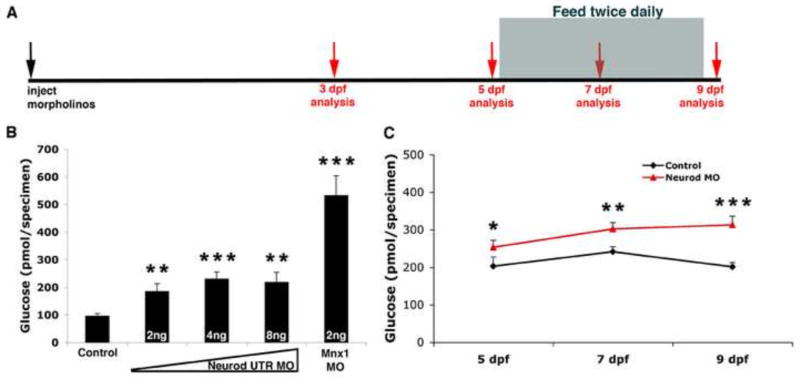
Fig. 8. Free glucose levels gradually increase in Neurod morphants.
(A) Experimental schedule. Morpholino injected Tg(neurod:EGFP) specimens were collected for free glucose assays at 3, 5, 7 and 9 dpf (red arrows). After 5 dpf, larvae were fed twice daily, and specimens were collected before feeding time on the appropriate days. (B) Free glucose levels in 3 dpf Tg(neurod:EGFP) control, Neurod morphant and Mnx1 morphant specimens (MO concentrations as indicated). Mean (± s.e.m) glucose levels from 4 independent experiments. (C) Free glucose levels from 5, 7 and 9 dpf Tg(neurod:EGFP) control and Neurod MO injected specimens. As free glucose levels were similar in Neurod ATG and UTR morpholino injected specimens these are presented together. Mean (± s.e.m) glucose levels from 4 independent experiments. *, P<0.15, **, P<0.04, ***, P<0.009; t-test, two-tailed distribution.

