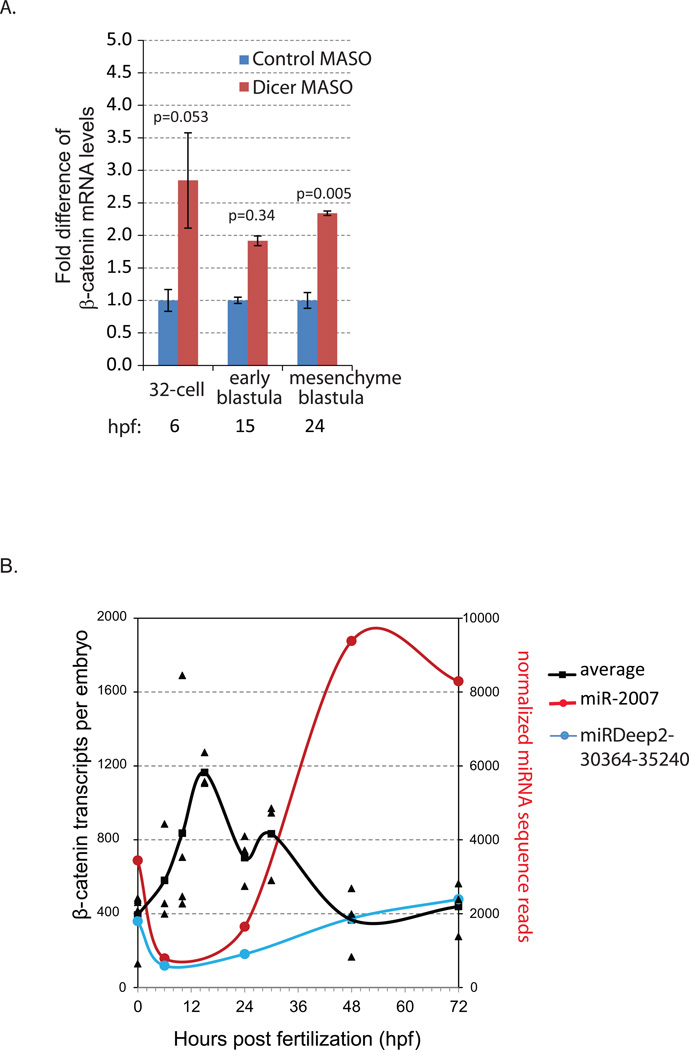
Fig. 1. Real time, quantitative PCR (qPCR) of β-catenin transcript levels.
(A) The transcript levels of β-catenin were measured in control MASO and Dicer MASO-injected (1.5 mM stock injection solution) embryos. Results were normalized to the mRNA expression of the housekeeping gene ubiquitin and shown as fold changes compared to control embryos that were injected with the control MASO using the ΔΔCt method. The transcript level of β-catenin was significantly more abundant in Dicer MASO than in the control MASO-injected embryos at the mesenchyme blastula stage. Standard error bars are graphed. At least three independent biological replicates with 80–100 embryos per replicate were tested. hpf= hours post fertilization. *Student T-test, p=0.005.
(B) Time course expression profile of β-catenin mRNA. The transcript levels of β-catenin were measured in uninjected embryos collected at various developmental stages. Results were normalized to the mRNA expression of the housekeeping gene ubiquitin. The estimated numbers of β-catenin transcripts are calculated based on the level of ubiquitin in various developmental stages described previously (Materna and Davidson, 2012; Materna and Oliveri, 2008). At least three independent biological replicates with 200 embryos per replicate were tested. 2.5 embryo equivalents were used. Individual data points are shown and the average is graphed as a line. β-catenin transcripts are most abundant between the 32-cell and early blastula stages. Its level decreases and stabilizes from the mesenchyme blastula stage to the larval stage. Normalized sequence reads of miR-2007 and miRDeep2-30364-35240 from our previous study are plotted (Song et al., 2012). β-catenin mRNAs and these miRNAs have inverse expression patterns.

