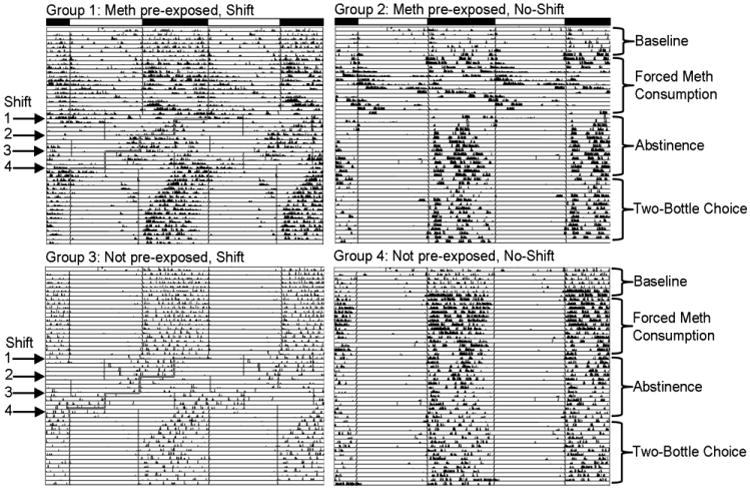
Fig. 3.

Running wheel activity records of one representative animal from each experimental group. Records are double-plotted so that each horizontal line represents 48 hours, and successive days are plotted below and to the right of the preceding day. The main light:dark cycle (lights on from 0500 – 1700) is represented by black and white bars above the top two records. For animals that received phase shifts, the advance of the onset of the light phase for each shift is highlighted in red within the records.
