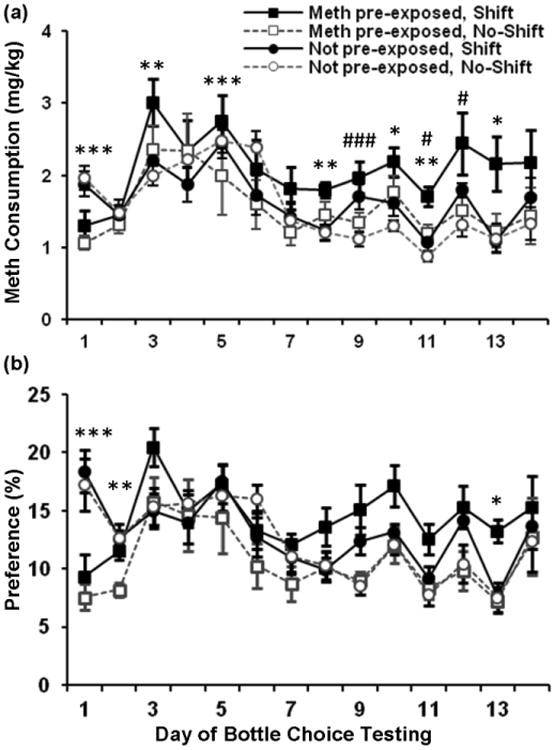
Fig. 4.

Mean (± SEM) daily methamphetamine intake (a) and daily percent preference (b) over 14 days of two-bottle choice testing. n = 8 animals/group. * p < 0.05, ** p < 0.01, *** p < 0.001, indicate significant differences between methamphetamine pre-exposed and not pre-exposed groups. # p < 0.05, ### p < 0.001, indicate significant differences between shift and no-shift groups.
