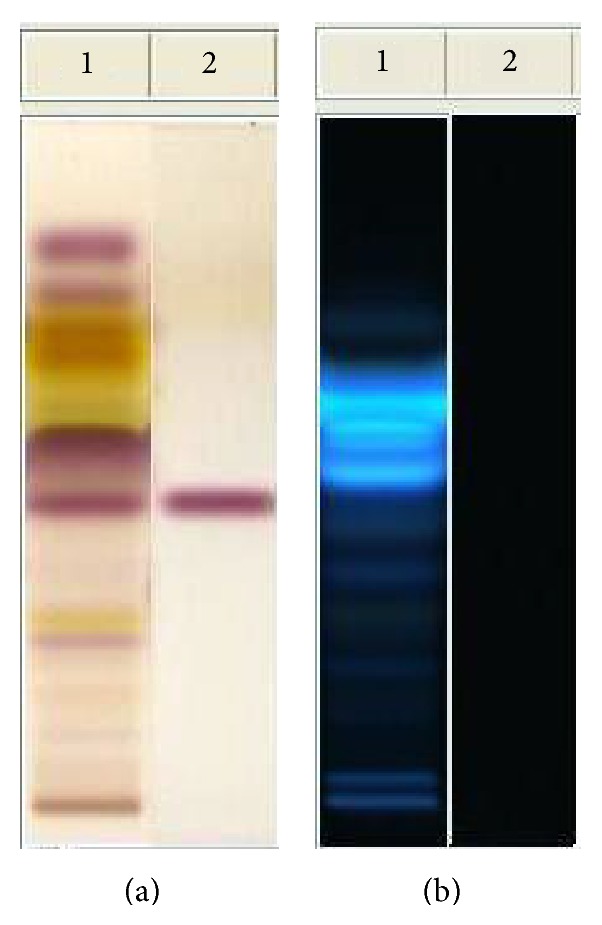
Figure 1.

HPTLC analysis of neem oil EtOAc extract. Mobile phase: toluene : AcOEt 7 : 3 (v/v). Visualization: plate (a) (on the left) white light upper and lower; plate (b) (on the right) UV lamp at 366 nm. Derivatization: p-anisaldheyde. Track 1: neem oil; track 2: salannin.
