Figure 2.

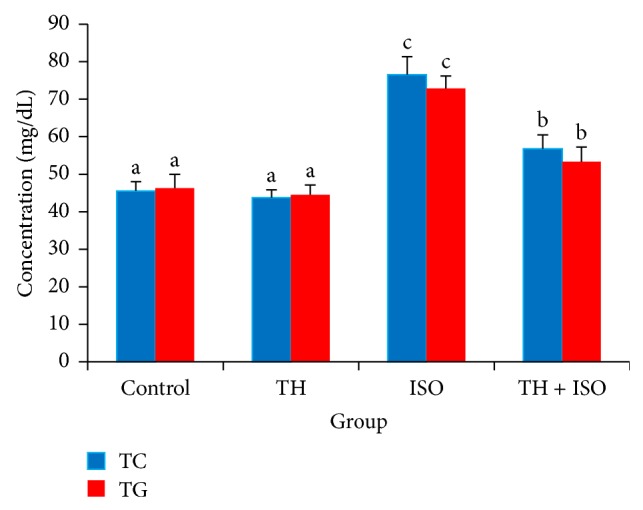
The protective effects of TH on serum TC and TG levels in rats, estimated directly using standard assay kit. The bars represent the mean ± SD (n = 10); bars with different letters are significantly different at p < 0.05.

The protective effects of TH on serum TC and TG levels in rats, estimated directly using standard assay kit. The bars represent the mean ± SD (n = 10); bars with different letters are significantly different at p < 0.05.