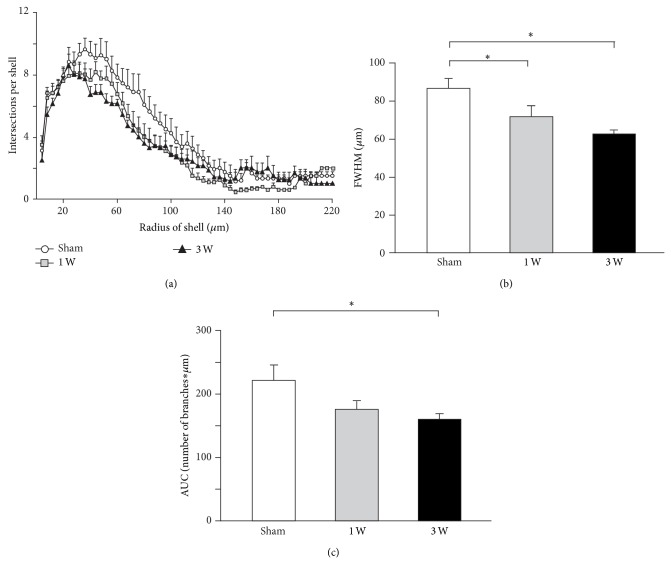
Figure 3.
Overall dendritic tree shrinkage in vM1 layer 5 pyramidal neurons following contralateral facial nerve axotomy. (a) Sholl analysis indicating the number of dendrite branches crossing concentric circles around the cell body. Symbols and associated error bars correspond to the mean ± SEM. (b) Full width half maximum (FWHM) of Sholl distribution from each experimental group. Bars and error whiskers represent the mean + SEM. (c) Sholl distribution area under the curve (AUC) from each experimental group. Bars and error whiskers represent the mean + SEM. 1 W, 1 week after peripheral nerve lesion; 3 W, 3 weeks after peripheral nerve lesion; ∗ P < 0.05.

