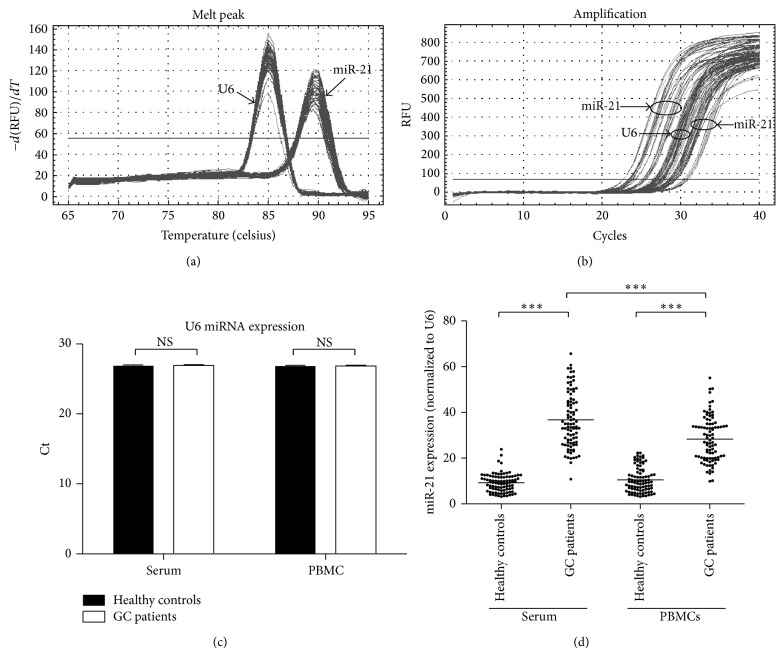
Figure 1.
qRT-PCR quantification of miR-21 in serum and PBMCs of GC patients and healthy controls. (a) Amplification curves of miR-21 and U6. (b) Melting curves of miR-21 and U6. (c) Ct values of U6 in serum and PBMCS from GC patients and healthy controls. (d) miR-21 levels in serum and PBMCs of GC patients and healthy controls. NS: not statistically significant; ∗∗∗ p < 0.001.

