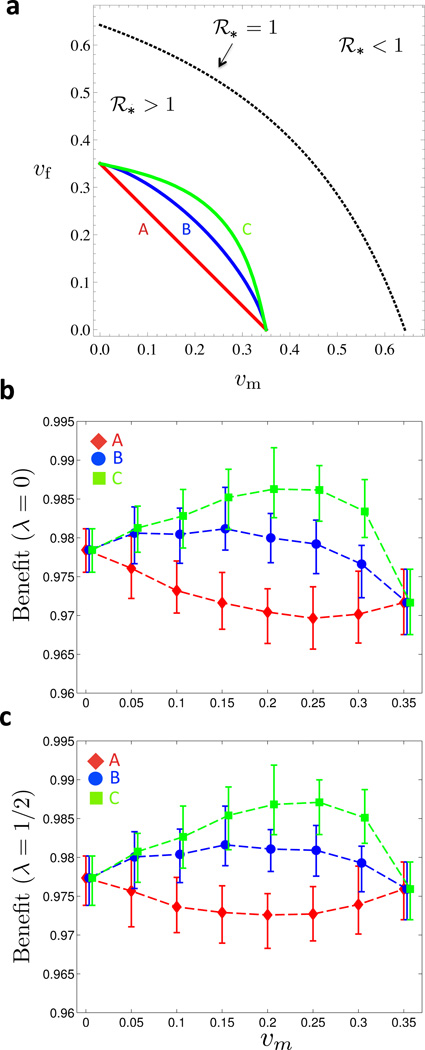
Figure 2. Benefit under symmetric cost curves.
(a) The three curves A, B and C are fixed-cost curves with differing levels of convexity (for the corresponding ratios of marginal administration to marginal fixed costs, see Figure 8): linear curve with no marginal costs associated with vaccine administration (A), mildly convex curve with high marginal costs of vaccine administration (B), and more convex curve with low marginal costs of vaccine administration (C). Maximal single-sex coverage is 35% for all three curves. In the region below the dotted line there is an endemic equilibrium (ℛ* > 1). Vaccination coverage on and above the dotted line confers herd immunity (ℛ* ≤ 1). (b) Moving along the level-sets of the cost functions A, B and C in (a), the vaccination benefit Bλ(υm, υf) is shown as a function of υm for λ = 0. (c) Same as (b) but with λ = 1/2. In (a) and (b), 25 simulations for each of the 26 Posterior Sets were run for 30 years. Prevalence levels were time-averaged between 15 and 30 years for each run, and the time averages were in turn averaged over the 25 realizations per Posterior Set. For each value of υm, the mean, minimum and maximum Benefits across the Posterior Set are represented by the symbol and the error bars, respectively. (Online version in color.)

