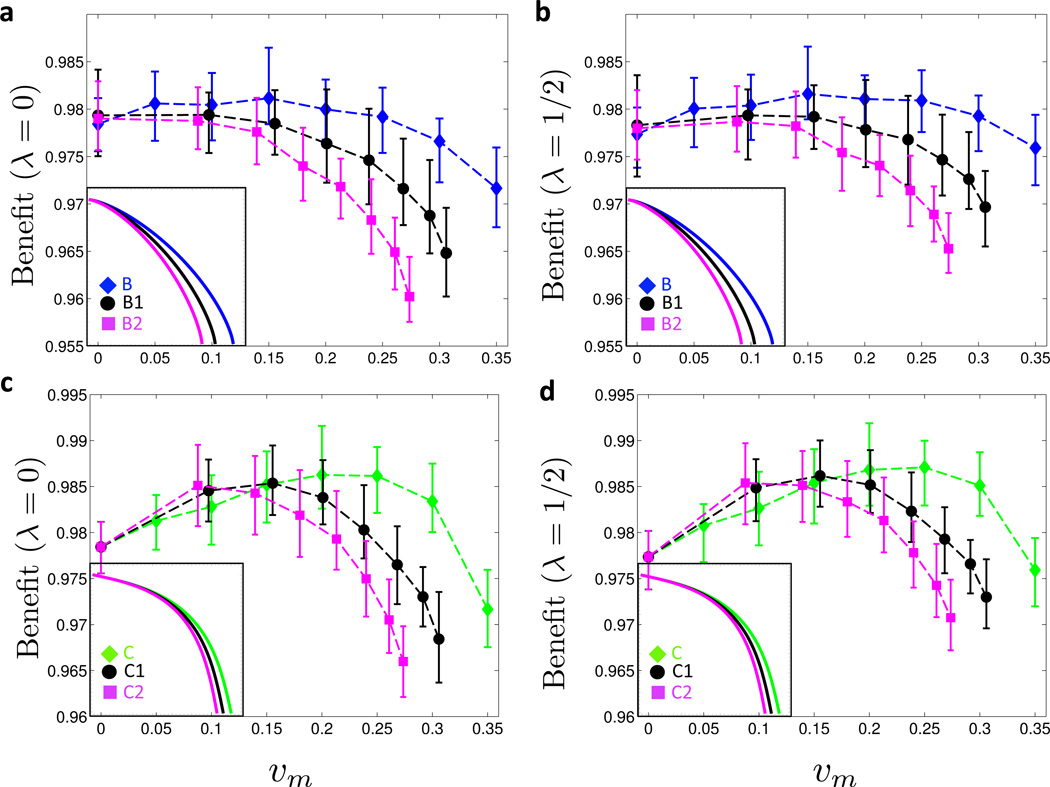
Figure 4. Benefit under asymmetric cost curves.
(a) and (b) Cost curve B from Figure 2a is rendered asymmetric (curves B1 and B2 in insets). Moving along these asymmetric cost curves, the benefit Bλ(υm, υf) is shown for λ = 0 in (a) and for λ = 1/2 in (b). (c) and (d) Cost curve C from Figure 2a is rendered asymmetric (curves C1 and C2 in insets). Moving along these asymmetric cost curves, the benefit Bλ (υm, υf) is shown for λ = 0 in (c) and for λ = 1/2 in (d). For details on averaging and meaning of symbols and error bars, see Figure 2. (Online version in color.)

