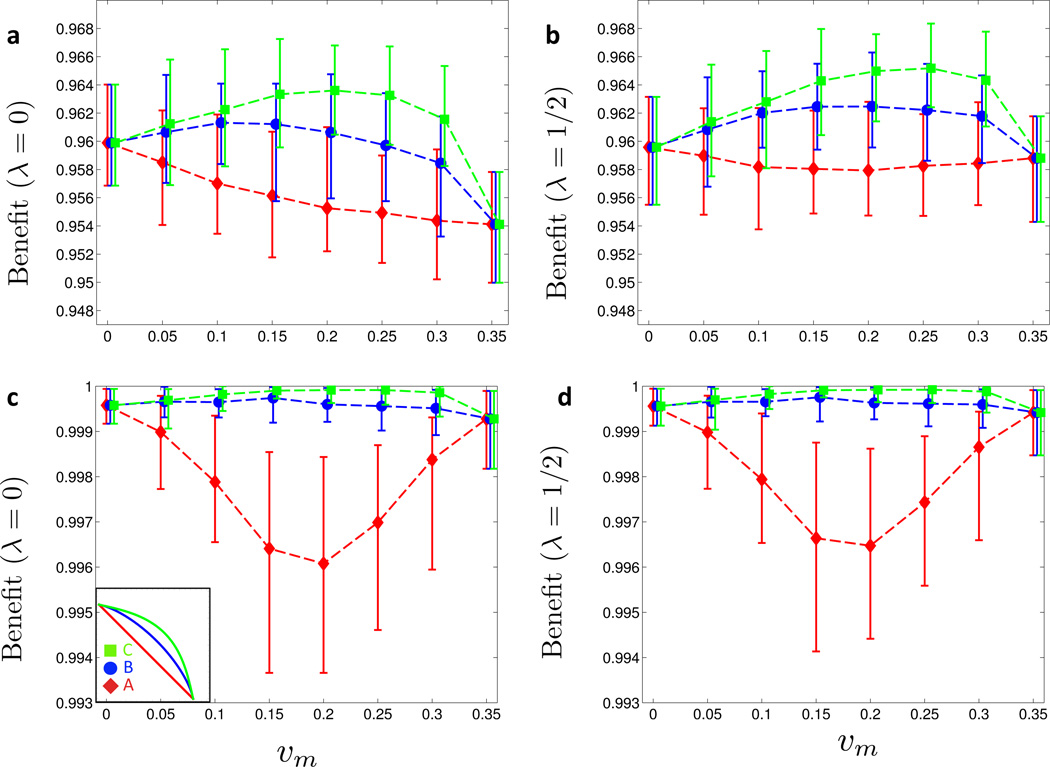
Figure 5. Assortative vaccine uptake (symmetric cost curves).
The symmetric cost curve analysis of Figure 2 is repeated with different types of assortative vaccine uptake. (a) and (c) Vaccine uptake correlates negatively with sexual activity level: at the beginning of the year, vaccines are distributed among the sexual activity levels as follows: L0 (low activity) with probability 1/2, L1 and L2 with probabilities 1/3 and 1/6, respectively, and L3 (high activity) with probability 0. The benefit Bλ (υm, υf) along the three symmetric cost curves A, B and C (see inset in (c)) is computed for λ = 0 (a) and λ = 1/2 (b). (c) and (d) Vaccine uptake correlates positively with sexual activity level: at the beginning of the year, vaccines are distributed among the sexual activity levels as follows: L3 (high activity) with probability 1/2, L2 and L1 with probabilities 1/3 and 1/6, respectively, and L0 (low activity) with probability 0. The benefit Bλ (υm, υf) along the three symmetric cost curves A, B and C (see inset in (c)) is computed for λ = 0 (c) and λ = 1/2 (d). (Online version in color.)

