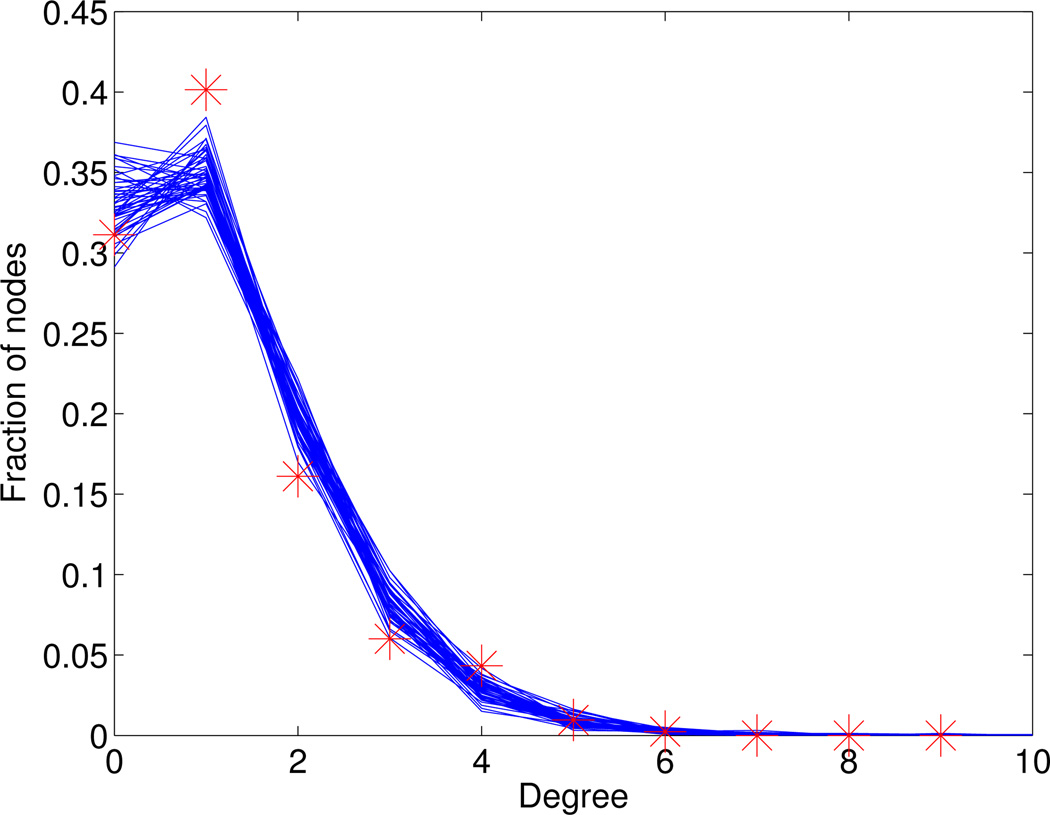
Figure 7. Degree distribution of sexual network.
For ℰ = 1.5, the network is first run until stationarity, and then the degree distribution of the cumulative network graph over 18 months (50 simulations, solid lines) is compared to the empirical degree distribution (star) as reported in [23].

