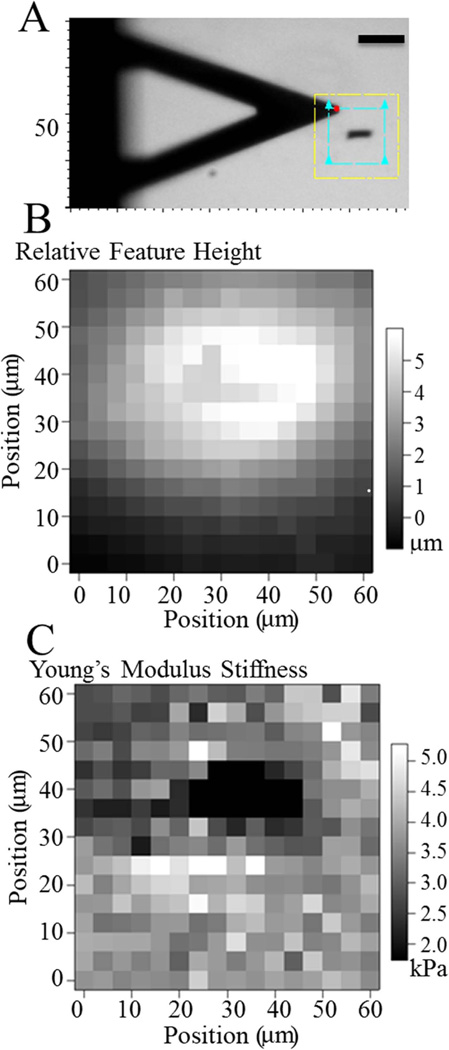
FIGURE 2.
Polymerization effects of microwires. A: Brightfield image of AFM scan area. Yellow box outlines the maximum scan area; blue box outlines the scan area used (60 × 60 µm2). Scale bar = 50 µm. B: Relative surface topography of an undeformed PA hydrogel over the microwire shown in panel A. C: PA hydrogel stiffness shown for the microwire shown in panel A. [Color figure can be viewed in the online issue, which is available at wileyonlinelibrary.com.]

