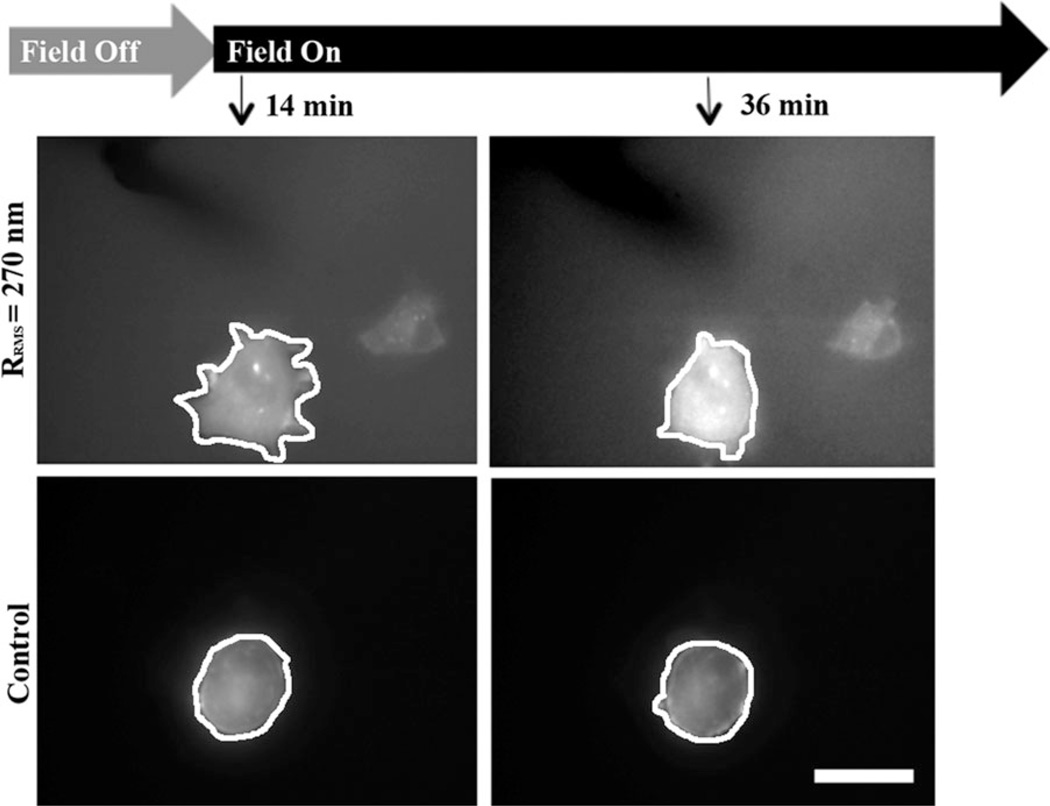
FIGURE 3.
Cells during a step topographical change. At the indicated times and magnetic field conditions (top), images were taken for an RFP-actin transfected cell on a hydrogel that was magnetically induced to have surface roughness of 270 nm (middle) and an RFP-actin transfected cell on a similar substrate without magnetic actuation (bottom). White lines have been added to illustrate the cell perimeter. Scale bar is 30 µm.

