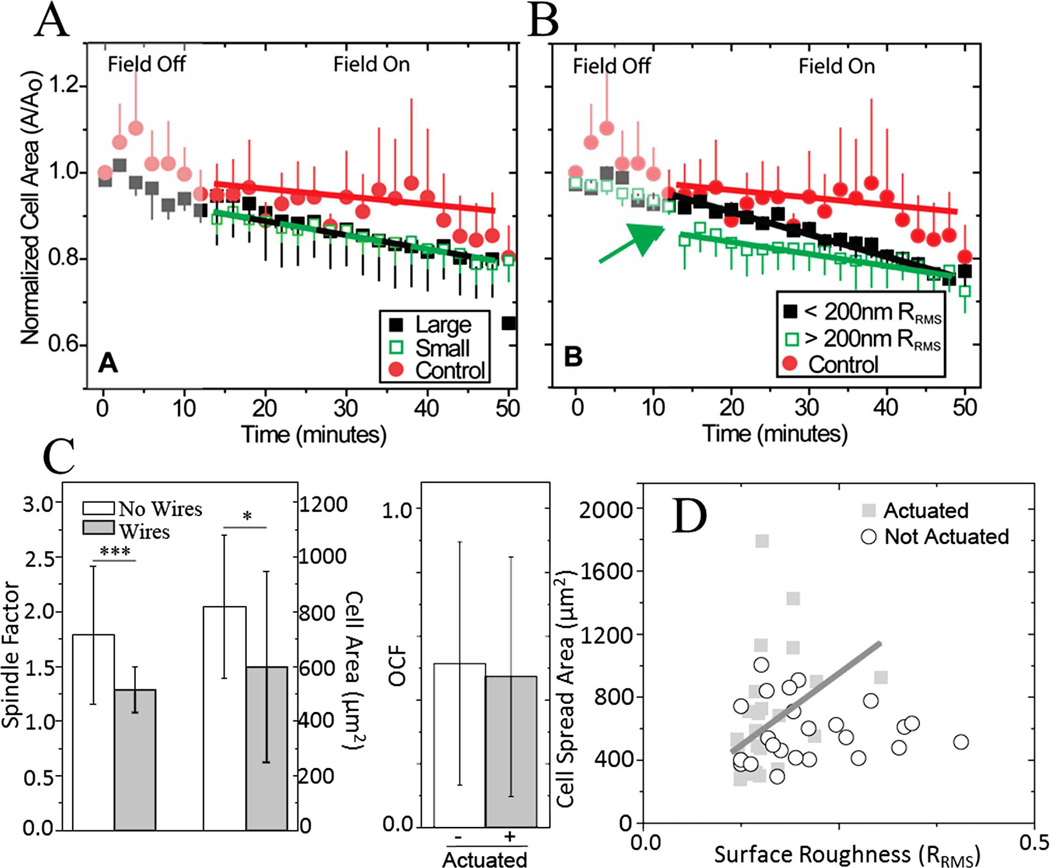
FIGURE 4.
Cell response to a step change and continuous modulation of topography after 1 h. Change in cell area (A/A0) shown as a function of time when binned by (A) size and by (B) surface roughness for a step change in roughness when the field was turned on as indicated. ANCOVA between two groups indicated that in regard to cell size, only the difference between the control and large cells was statistically significant (p < 0.001) and for surface roughness, the difference between all of the groups was statistically significant (p < 0.005). Error bars are shown as standard error of the mean. C: On the left, cell spread area and shape factor shown as a function of the embedded microwires’ presence after 1 h. ***p < 0.001, *p < 0.05. On the right, OCF was measured between cells and microwires for both the actuated and nonactuated substrates after 1 h of actuation (p = 0.64). D: Plot of the relationship between surface roughness and cell spread area for cyclically actuated and nonactuated substrates after 1 h of magnetic actuation. [Color figure can be viewed in the online issue, which is available at wileyonlinelibrary.com.]

