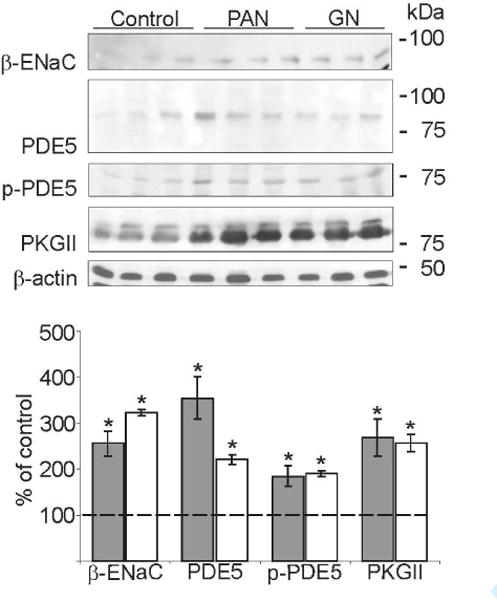
Figure 7. Alterations in abundance of β-ENaC and ANP signaling components in proteinuric kidney diseases.

Western blots of medullary β-ENaC, PDE5, phospho-PDE5 (p-PDE5), PKGII and β-actin (as loading control). Compared to controls strongly increased expression levels are present in PAN (grey bar) and GN (white bar) rats for all parameters analyzed. Densitometric evaluations are presented below. Values are means ± SE; n=5 per group; *P < 0.05.
