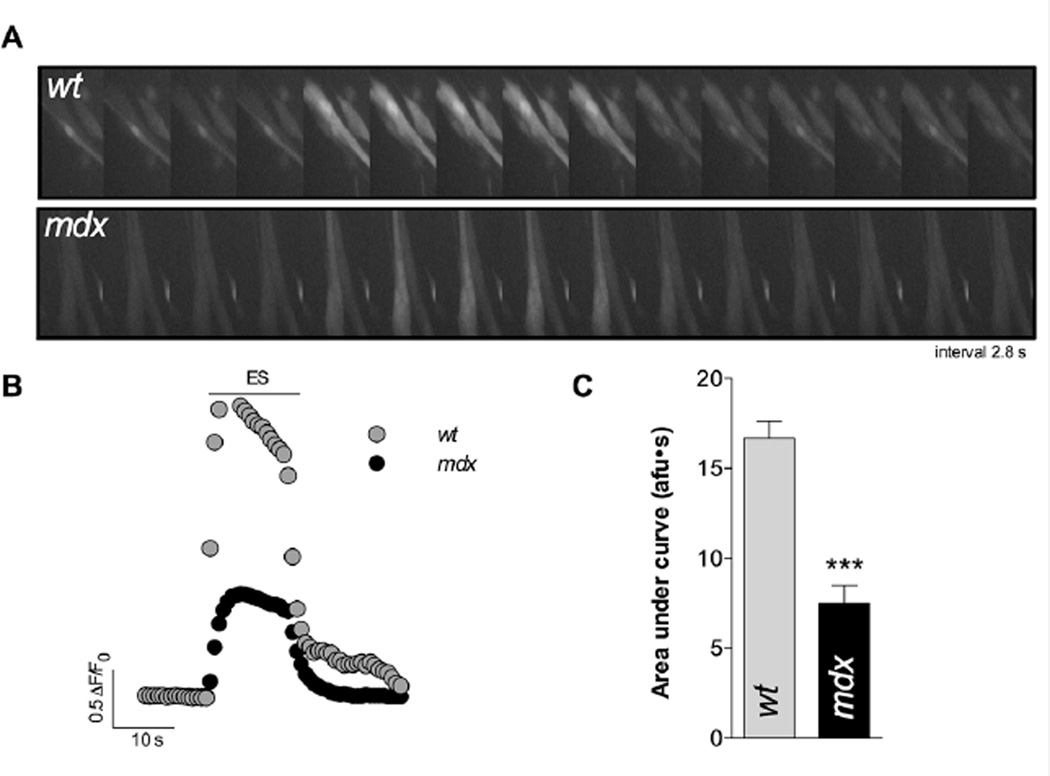
FIGURE 3. Ca2+ transients elicited by ES in both wt and mdx myotubes.
A. Representative fluorescence images and B. representative traces obtained with Fluo3-AM and epifluorescence microscopy. C. Quantification of the area under the curve of the evoked transients. (n=40 cells for wt and n=40 for mdx myotubes, from at least 3 independent cultures, respectively). ***=P<0.001

