Fig. 4.
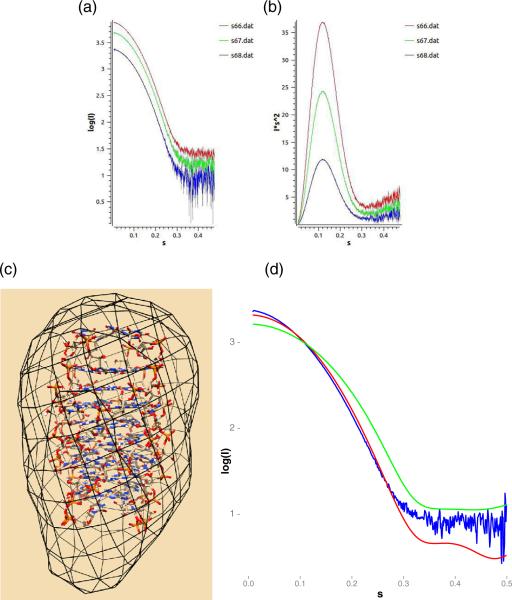
SAXS analysis. (a) Intensity of buffer-adjusted scattering for UGGGGU samples at concentrations of 0.4 mg/ml (red), 2 mg/ml (green) and 4 mg/ml (blue). (b) The corresponding Kratky plots. (c) The ab initio model derived by DAMMIF from merged scattering data displayed as a black mesh and fit to the symmetry-expanded octamer from structure P1B. (d) Comparison of the experimental scattering curve, merged over all concentrations and shown in blue, relative to predicted scattering from octameric and tetrameric models derived from structure P1B, shown in red and green.

