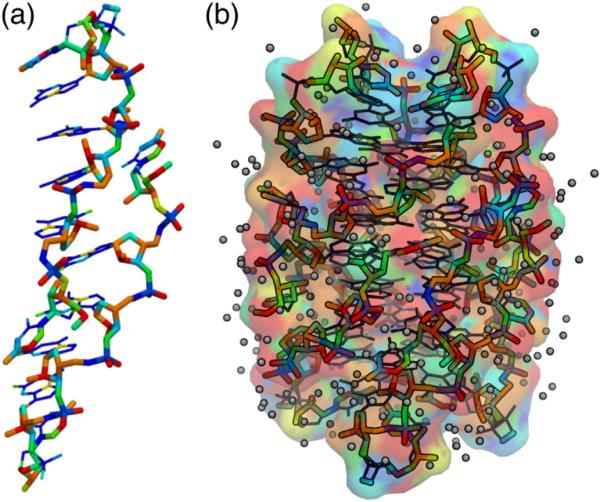
Fig. 8.

Hydration by atom type. (a) The two strands from structure P1A are shown with atom types colored by hydration index value (Supplemental Table 1). Atoms with a hydration score below 0.25 are shown by blue thinner lines. (b) The hydration-based coloring scheme extended to the symmetry-expanded P1A octamer with waters included; the molecular surface is also colored by hydration value.
