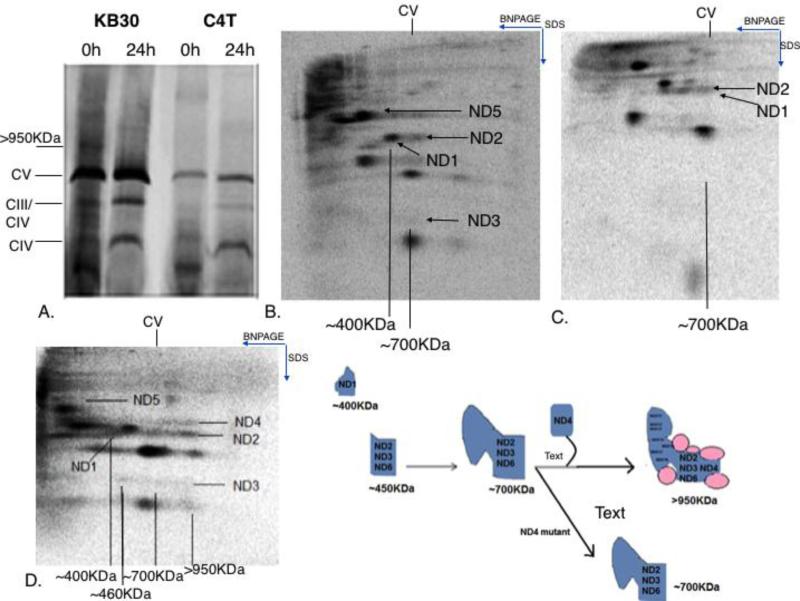
Figure 5. Lack of assembly of Complex I in ND4 mutant cells.
A) shows the 1D BNPAGE of KB30 and ND4 mutant C4T cells at the 0 h and 24 h time points of [35]S labeling. An early Complex I band is seen in KB30 at 0 h but not in C4T cells. B) Shows the 2D SDS PAGE of C4T cells and D) KB30 cells at 0 h time point after [35]S labeling and C) shows the 2DSDS PAGE of C4T cells and E) KB30 cells at the 24 h time point after [35]S labeling. The cartoon shows the presence of the ~400KDa and ~700KDa subcomplexes seen in the 2DSDS profile in ND4 mutant cells.

