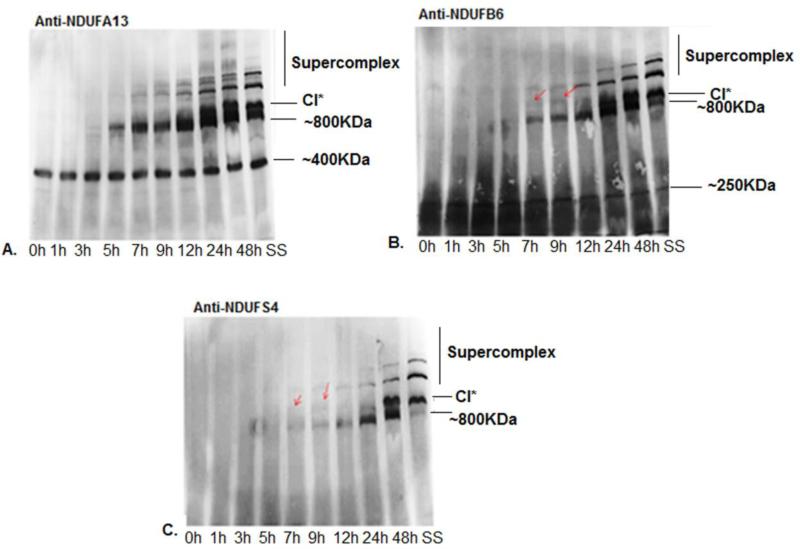
Figure 6. Incorporation of nuclear encoded subunits in Complex I assembly.
Using chloramphenicol treatment for 6 days followed by recovery at different time points, indicated below each image, to document the incorporation of the following Complex I subunits in Complex I assembly A) anti- NDUFA13 antibody, B) anti-NDUFB6 antibody, C) anti-NDUFS4. Red arrows indicate the position of the >950KDa complex I intermediate while other Complex I subcomplexes have been indicated by their molecular weights. SS denotes steady state controls i.e. Complex I bands observed at steady state only. These samples were not treated with chloramphenicol.

