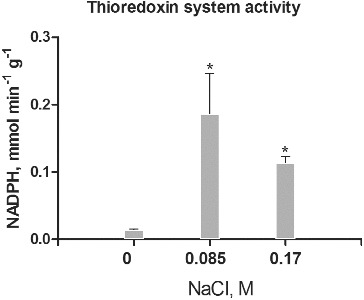
Figure 3.

Thioredoxin/thioredoxin reductase system activity in salt-treated suspension cultures. Columns represent mean values and ±SD (n = 3). Significant values, compared to controls are indicated (*) as calculated by Student's t-test, p < 0.05. Activity is expressed as mmol oxidized NADPH per minute per g protein.
