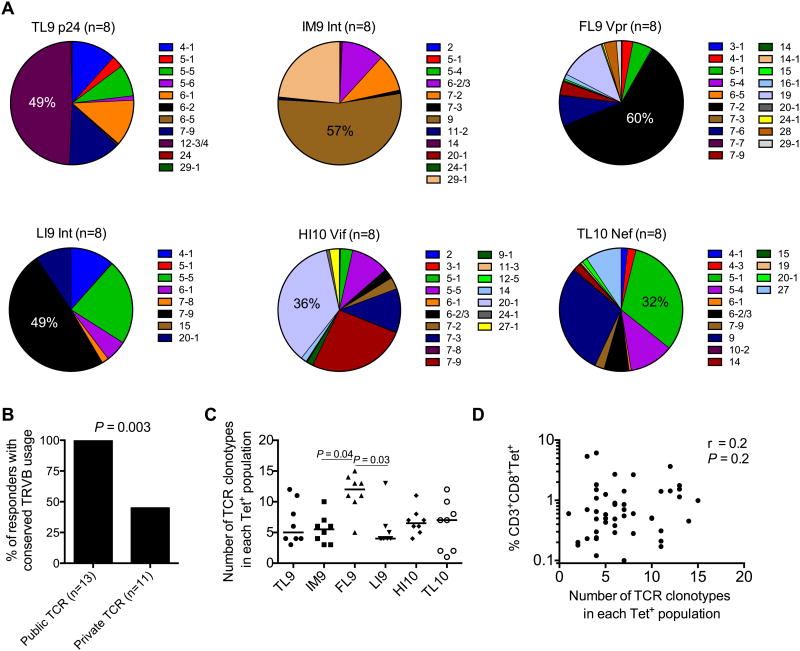
Figure 5. Clonality and TCR bias in HLA-B*42:01-restricted epitope-specific responses.
(A) TRBV usage is depicted for six different HLA-B*42:01-restricted epitope-specific responses. The number of individuals analyzed is indicated in each case. (B) Percentage of responders to Gag-TL9, Int-IM9 or Vpr-FL9 stratified for the presence of public TCRs. Significance was determined using Fisher's exact test. (C) Number of different TCR clonotypes detected in each of the six epitope-specific responses. P values <0.1 by Dunn's multiple comparisons test are shown. (D) Correlation between clonality and response magnitude. Significance was determined using the Spearman rank test.

