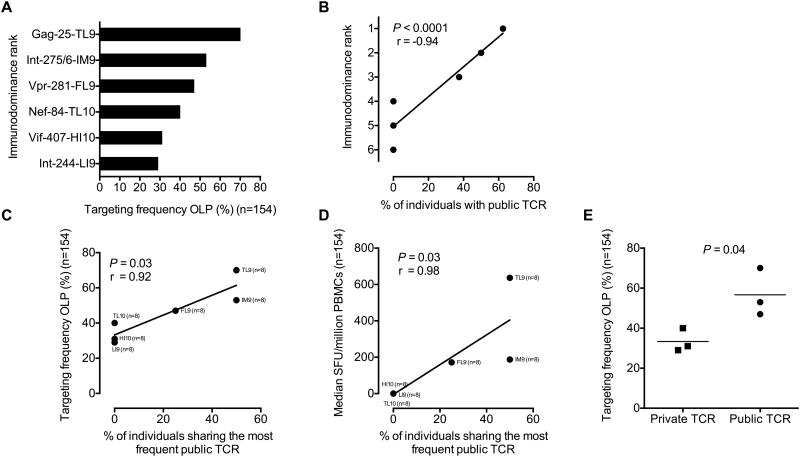
Figure 6. Epitope targeting frequency correlates with shared TCR recruitment.
(A) Targeting frequencies for six optimal epitopes in HLA-B*42:01+ individuals, stratified for lack of HLA-B*07:02/39:10/42:02/81:01 co-expression (n=154). (B) Immunodominance rank, shown as most targeted ranked 1, versus the percentage of individuals sharing any public TCR. Significance was determined using the Spearman rank test. (C) Targeting frequencies for the same six epitopes versus the percentage of individuals sharing the most frequent public TCR. Significance was determined using the Spearman rank test. (D) Response magnitude, including responders and non-responders (mean), versus the percentage of individuals sharing the most frequent public TCR. Significance was determined using the Spearman rank test. (E) Targeting frequencies for all six epitopes stratified for the presence or absence of public TCRs. Significance was determined using the Mann-Whitney U-test.

