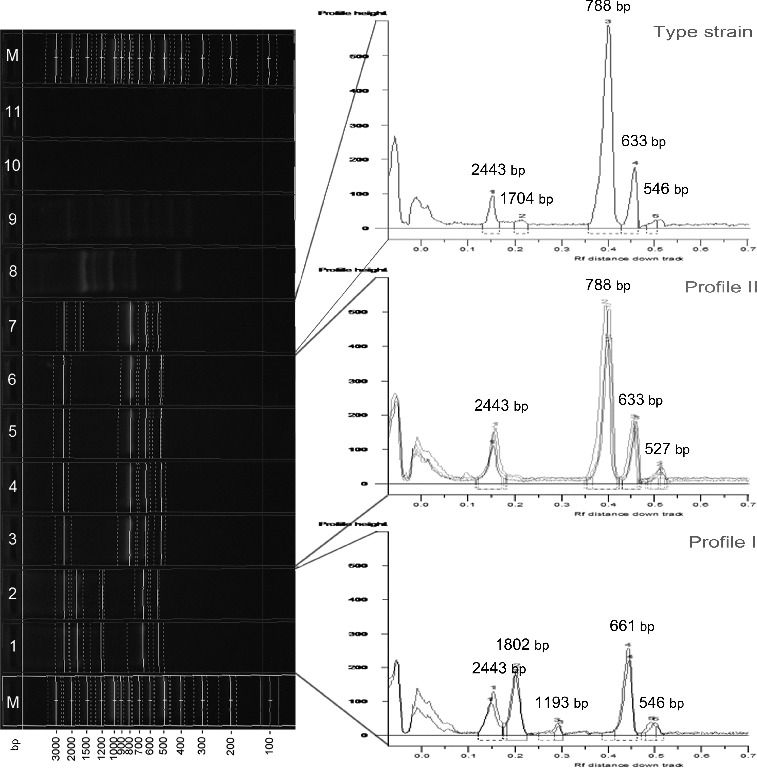
Figure 4.

RAPD analysis with primer CUGEA-6. On the right: M – DNA ladder, 1, 2 – representative X. euvesicatoria strains forming profile I, 3–6 – representative X. euvesicatoria strains forming profile II, 8 – X. vesicatoria, 9 – X. gardneri, 10 – X. perforans, 11 – PCR mix. On the left: graphs of the two profiles and the profile of the type strain X. euvesicatoria NBIMCC 8731. The numbers on the top of the graphs correspond to the length of the amplicons.
