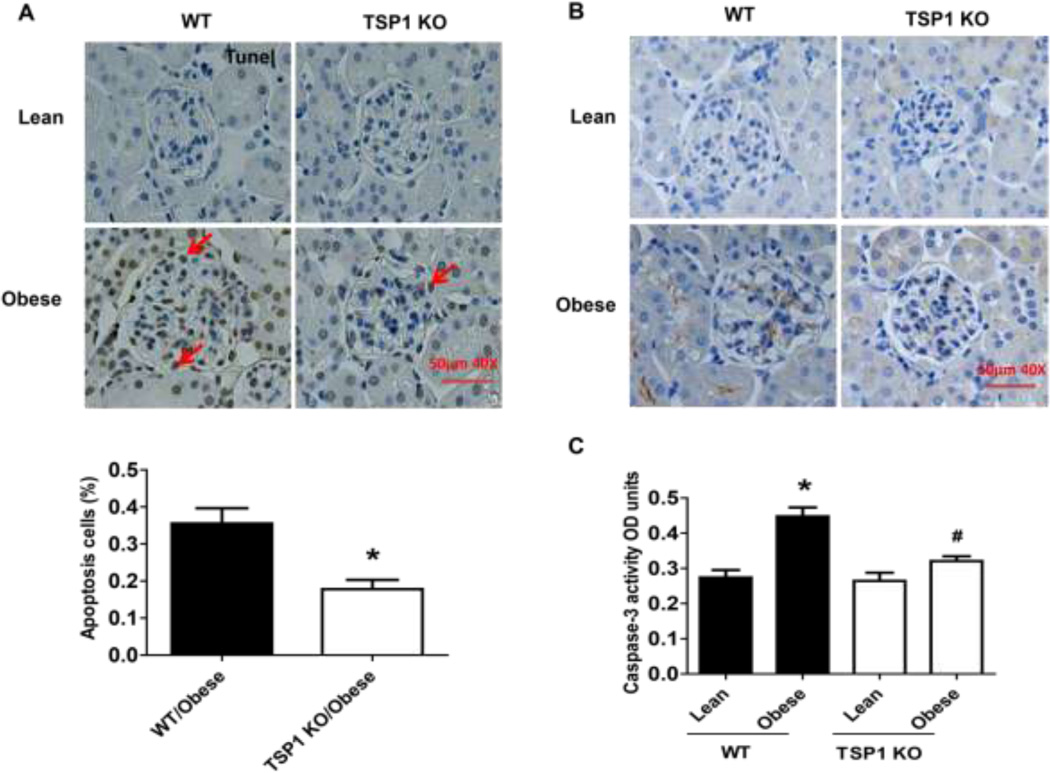
Figure 9. Obesity induced podocyte apoptosis were attenuated in TSP1 KO mice.
Apoptosis cells were calculated after TUNEL staining (A). The scale bar represents 50 µm. In addition, glomerular caspase 3 protein expression (B) and caspase 3 activity (C) were determined by immunochemical staining and caspase-3 colorimetric assay kit, respectively. Data are presented as mean ± SE (n = 10 mice/group). *, P <0.05 vs. WT/lean group; #, P <0.05 vs. WT/obese group.

