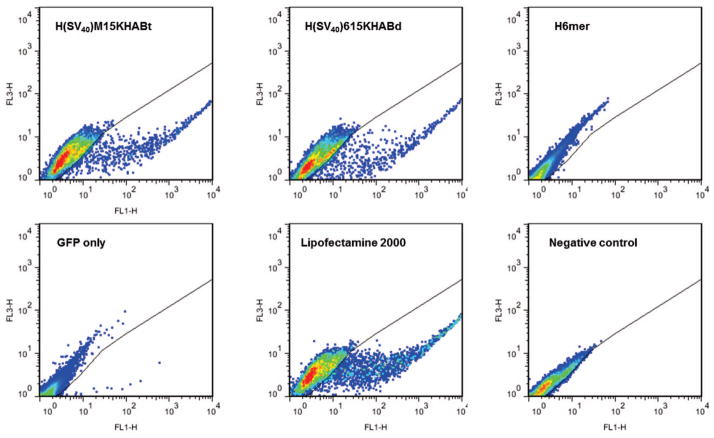
Figure 5.
Flow cytometry analysis of Green Fluorescent Protein expression achieved with H(SV40)M15HABt, H(SV40)615KHABd, H6mer, naked pDNA encoded GFP (GFP only), and Lipofectamine 2000 24 hours after transfection. Untransfected population of hMSCs served as a negative control. FL1-H vs.FL3-H dot plot was used for analysis.

