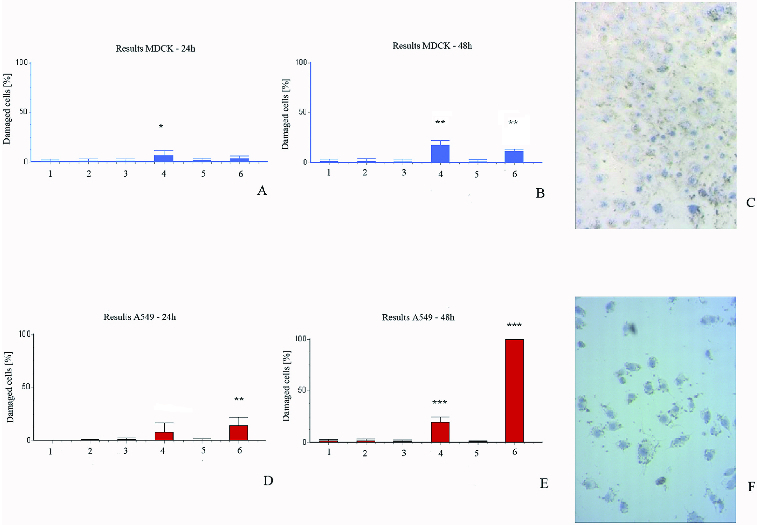
Figure 3.

Membrane permeability test with trypan blue exclusion. MDCKII cells (A, B and C) and A549 cells (D, E and F) after 24 h (A and D) and 48 h (B, C, E and F) treatment. 1 – control; 2 – control with DMSO; 3 – cells with methanol extracts from in vivo plants; 4 – cells with chloroform extracts from in vivo plants; 5 – cells with methanol extracts from in vitro plants; 6 – cells with chloroform extracts from in vitro plants.
