. 2014 Oct 17;28(4):740–746. doi: 10.1080/13102818.2014.943019
© 2014 The Author(s). Published by Taylor & Francis.
This is an Open Access article distributed under the terms of the Creative Commons Attribution License http://creativecommons.org/licenses/by/3.0/, which permits unrestricted use, distribution, and reproduction in any medium, provided the original work is properly cited. The moral rights of the named author(s) have been asserted.
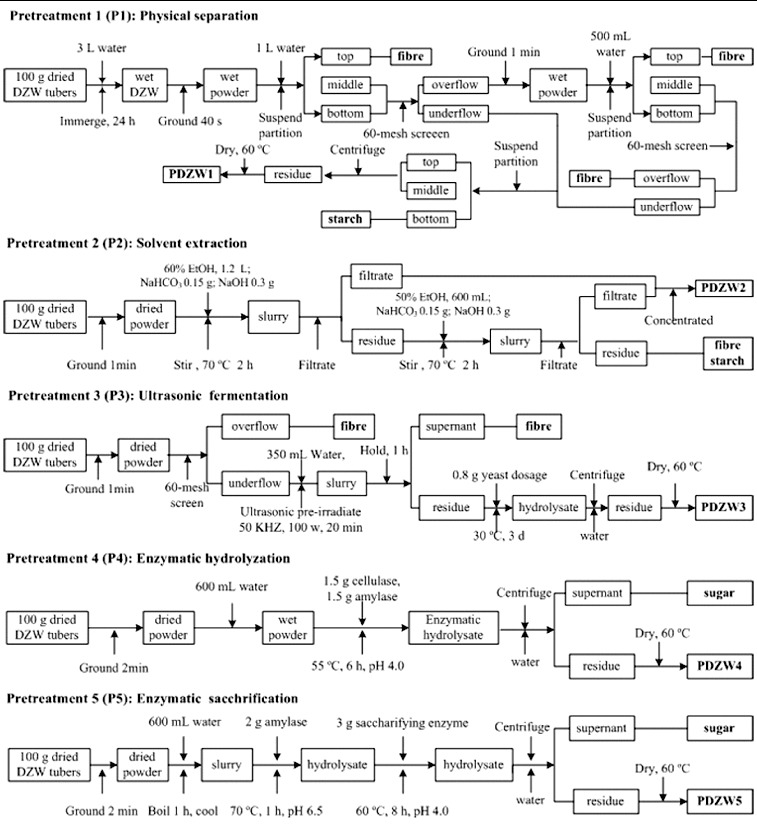
Figure 1.

Flow charts of pretreatment methods used in the experiments.
