
Figure 4.
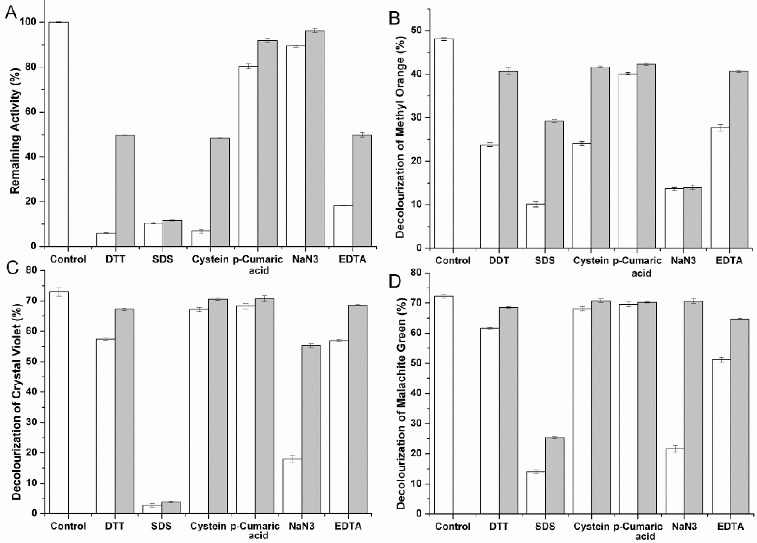
Effect of inhibitors on purified enzyme activity (A) and decolourization of methyl orange (B), crystal violet (C) and malachite green (D). White bars represent the effect of inhibitors at the higher of the two concentrations tested; grey bars represent the effect at the lower concentration (see Section Materials and Methods). Measurements were performed under optimum conditions. Reactions were stopped with 50 μL of 0.1% NaF after various durations. Values are means ± SD of three independent experiments.