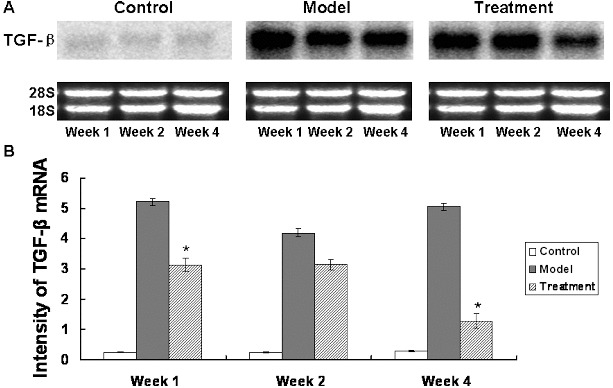
Figure 1.

Northern blot analysis of the TGF-β expression at the mRNA level. Pulmonary tissues of the control group, the model group and the treatment group were collected at week 1, week 2 and week 4 after modelling. Total RNAs were extracted from these pulmonary tissues for northern blotting analysis. (A) Representative results of northern blots probed with TGF-β; ethidium bromide staining of 18S and 28S rRNA indicated the integrity and equal gel loading of RNA. (B) Quantitative northern blots results of TGF-β intensity. Compared with the model group, *P < 0.05.
