
Figure 3.
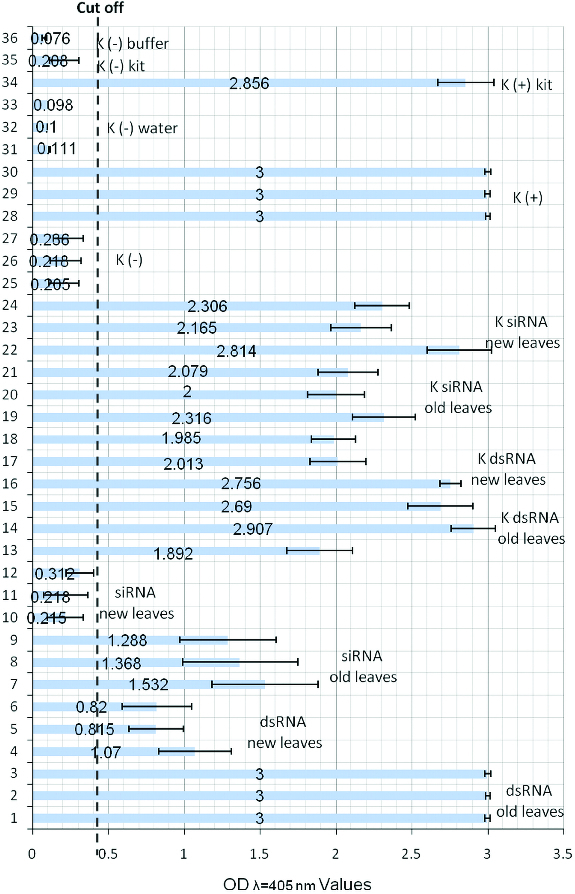
DAS-ELISA of potato plants after treatment with dsRNA and siRNAs. OD values of samples from: 1/3 – old leaves (at the moment of treatment and virus inoculation) of potato plants treated with HC-Pro dsRNAs and inoculated with PVY; 4/6 – new leaves (leaves grown after treatment) of potato plants treated with HC-Pro dsRNAs and inoculated with PVY; 7/9 – old leaves and 10/12 – new leaves of potato plants treated with HC-Pro siRNAs and inoculated with PVY; 13/15 – old leaves and 16/18 – new leaves of potato plants treated with control dsRNAs from the S segment of Phi 6 and inoculated with PVY; 19/21 – old leaves and 22/24 – new leaves of potato plants treated with control siRNAs from the S segment of Phi 6 and inoculated with PVY; 25/27 – control leaf samples of healthy potato plants not treated and not inoculated with virus; 28/30 – control leaf samples of potato plants inoculated with PVY and not treated; 31/33 – control leaf samples of healthy potato plants treated only with water; 34 – K+ control from the Kit; 35 – K− control from the Kit; 36 – buffer control.