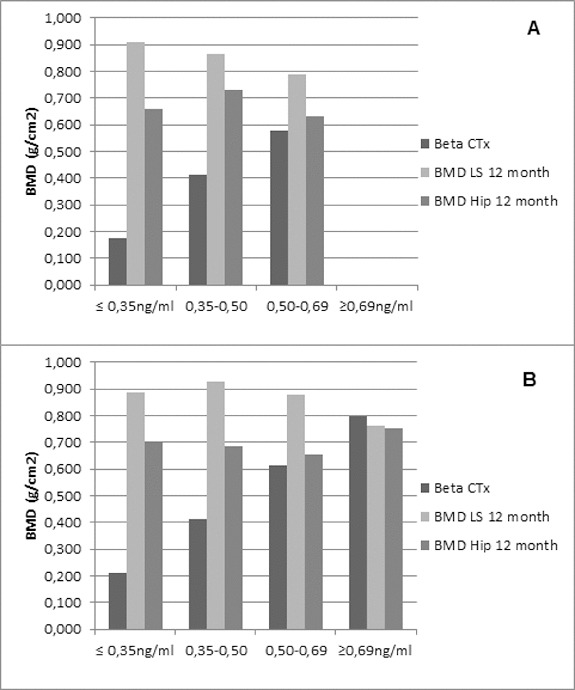
Figure 8.

Correlation between BMD change (lumbar spine and hip) and Beta-CTx. Patients were divided into four groups on the basis of their baseline Beta-CTx measures. Data are presented as mean values of baseline Beta-CTx (per group) and mean BMD change (lumbar spine and hip, also per group) at month 12. (A) Non-GCT group. (B) GCT group.
