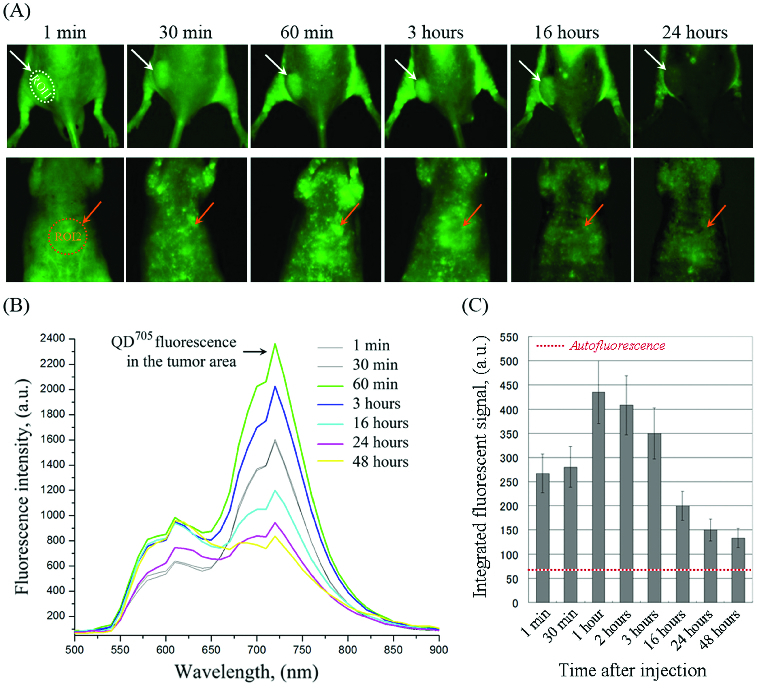
Figure 2.

(A) Representative fluorescent images of colon cancer-grafted mouse, obtained at different time-intervals (within 24 hours) after i.v. injection of QD705-labelled polymersomes. Regions-of-interest (ROI): ROI-1 – tumour area; ROI-2 – liver area. (B) Dynamics of fluorescent spectra in tumour area (ROI-1), overlapped with autofluorescence spectra of mouse body, obtained within 1–24 hours after i.v. injection of QD705-labelled polymersomes. The fluorescent spectra were extracted from the images in (A). (C) Kinetics of QD705 fluorescence decay in ROI-1 within 48 hours after injection, calculated at λem = 705 nm. The data are means ± SD from four animals.
