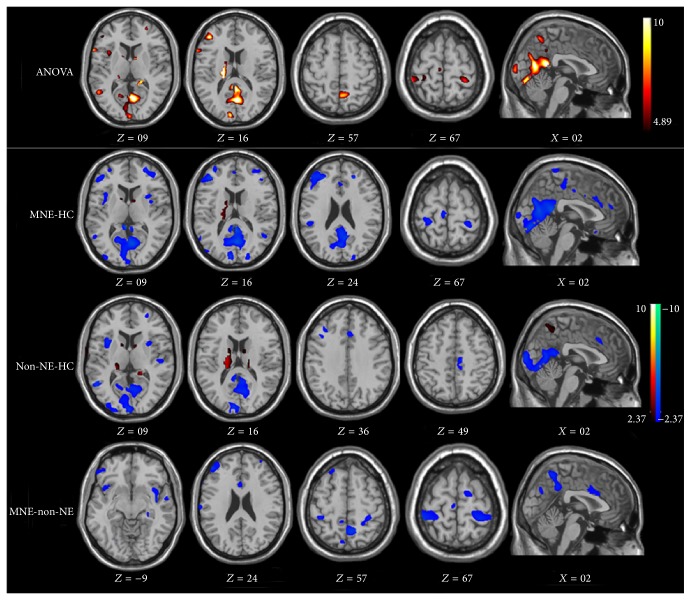
Figure 1.
ANOVA test result and multiple comparisons of gray matter between groups. Compared with healthy controls, minimal nephroencephalopathy patients show decreased gray volume in the bilateral occipital lobes, precuneus/posterior cingulate cortex/cuneus, right frontal lobe, bilateral temporal pole, and left insula. Compared with healthy controls, nonnephroencephalopathy patients show decreased brain volume of bilateral occipital lobes, bilateral temporal poles, and posterior cingulate cortex/precuneus/cuneus and increased brain volume of right extra-nuclear, right caudate, and right thalamus. Compared with nonnephroencephalopathy patients, minimal nephroencephalopathy patients show decreased brain volume of right middle frontal gyrus, right postcentral gyrus, right occipital lobe, and left insula.

