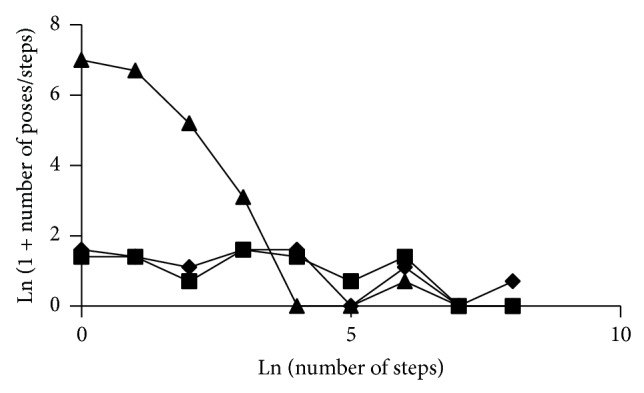
Figure 3.

Specific versus nonspecific binding. The number of steps per pose is plotted versus the number of poses with a specific number of steps. A high value on the vertical axis indicates many low-affinity poses. A high value on the horizontal axis indicates a few high-affinity poses. Triangles, AcrB/toluene; squares, AcrB/acridine orange; diamonds, AcrB/minocycline. The graph for skatole was nearly identical to the line for toluene except for a single higher affinity site and is omitted for clarity. See text for details.
