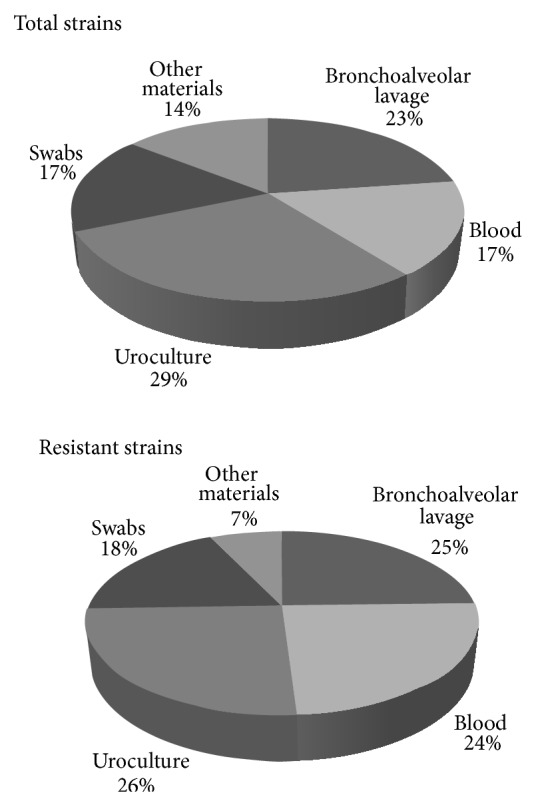
Figure 2.

Distribution of K. pneumoniae isolates by type of biological materials. The above pie chart shows the total distribution of K. pneumoniae isolates by several biological materials. The pie chart below shows the distribution of K. pneumoniae resistant isolates by several biological materials.
